INFOGRAPHICS RESOURCES
for PSY1845 Stigma, Discrimination, and Health
Application Task #2 Prompt
Prepare a 1-page infographic that visually depicts the social force —of the type described by this week’s readings—that keep the stigma that you are focusing on this semester in, down, and/or away in the context of unequal power.

Infographics combine data, text and graphical design to offer viewers compelling and informative arguments and explanations. And while infographics are frequently created with digital tools, for this assignment you are also free to create your visual explanation with paper, pens and pencils (though we will provide information on digital tools below as well).
The process of creating an infographic can also be helpful to you, the creator, because the process of visually structuring your explanation will help you refine your sense of how the subject matter itself is structured.
The Bok Center's Learning Lab has compiled some resources and tips here to help you create your infographics, but if you don't find exactly what you're looking for, or want a walkthrough of something specific, or run into challenges, don't hesitate to submit a question at help.learninglab.xyz! We'll start with the tools in case you just want to get started immediately, but, if you can, stay tuned all the way to the bottom of the page for additional thoughts on the what and why of infographics.
1. Tools
You have two basic options--both of which are fine: either create the infographic on paper and submit a photo, or create with a digital tool.
Paper, etc.
You can work with plain or colored paper and cut it up, mark it up, fold it—whatever you think will help you capture your ideas best (and make these ideas legible to your audience). Since you will not have access to some of the automated layout features that digital tools involve (i.e. auto-centering, snapping-to-align, etc.) you will have to take additional care when positioning the elements of your infographic!

Once done, take an overhead shot of the completed infographic and submit it to Canvas. If the camera is directly above the paper, and all the angles are square, you should end up with a perfect, undistorted shot. Try to capture somewhere with flat, even light. And sometimes it actually helps to be a little further above the page and then zoom in, if your phone or camera allows you to do that.
Digital Tools
There are a number of excellent, free resources for creating infographics online, including Canva, Google Slides, and the Adobe Creative Suite. While you are invited to use any tool you are comfortable in, we'll provide more resources on Google Slides because it is efficient to work with but perhaps, more importantly this term, because it's collaborative.
Google Slides
2. Graphic Design Basics
-
-
- The best infographics leverage principles and elements of graphic design to tell their stories. These principles show up both at the macro level-- What does the grid layout of your poster say about the relationships between your figures?-- and also on the micro level-- How do the colors you've chosen for that one chart represent the contrast between categories?
- The grid
- The title
- The text blocks
- The data visualizations
- The icons
- The flow of information
- The call to action
- The whole composition is balanced and orients the audience, drawing the eye through the different pieces of visual information. There are no extraneous distractions visually. Every aesthetic choice plays a functional role in supporting my argument.
- The parts of my composition are aligned, providing order and clarity.
- Hierarchy, proximity and contrast successfully show relationships in my argument/ between pieces of information
- Repetition, association, and alignment support my argument and the balance of the composition.
- Overall, an intelligent non-expert can easily understand the argument
- The intended audience is clearly targeted through appropriate use of typography, icons, etc.
- Thirteen Reasons Why You Brain Craves Infographics: An infographic about the effectiveness of infographics
- Types of Infographics: An overview of some common infographic formats with templates
- Pinterest of Design Principles
- datasketches: Some beautiful data-driven graphics and notes on the process behind them for inspiration
- The Noun Project: Database of free icons
- Explore color palettes: Coolors and Colormind
- The Bok Center's pinterest on information design
- The Bok Center's pinterest on graphic design
- Canva's best infographics
- 15 steps to make an infographic
- How to tell a story with data
- Journalistic strategies for data visualization
- Adobe CC for science
3. Why Infographics?
Infographics. They capture our attention with their bright colors and their, seemingly, simple messages. They are used for everything from public health campaigns to instructions to putting together that bookshelf in a box you just bought. Because infographics are all about distilling information to a few key takeaways, you might think this makes them stronger as marketing devices than as a medium for academic communication, but infographics have a lot to offer social scientists.
If your data describes processes that take place in time or across space (so really any process), infographics can effectively communicate these progressions. Think about how much harder it is to give directions merely verbally than to pull out a Google map. There's a reason why we quickly reach for that map. Our brains process visual information more quickly and processing information both visually and verbally can lessen cognitive load. Using an infographic to convey your map-based data can allow you to leverage this visual processing.
Likewise processes of all types, whether human migrations or biochemical processes, are often cyclical or otherwise non-linear. Prose, on the other hand, is by nature linear. While prose can describe non-linear relations, the only relation it can show is concatenation, one thing following another. Thus, prose isn't always ideally suited to capture the richness of the directionality of processes. Infographics, on the other hand, can leverage design elements like line and shape to literally show the viewer these extra dimensions.
Processes aside, infographics also allow you to leverage visual principles to perform many of the key "moves" of analysis you might perform in an essay. For example, grid layouts and hierarchies can be used to setup comparisons. Since prose alone only allows for sequential presentation of the events, places, people, etc. that you might compare, infographics as a medium have the advantage here. With an infographic you can literally place those objects side-by-side using design elements like alignment and shape to indicate similarity and color contrast and size to highlight difference.
Finally, the best infographics often read at different "levels". There's a gestalt that I as a viewer get in a quick glance. This is essential; if it's missing, I won't stop and give the infographic a second look. But this second look is where the infographic reveals its richness. Each shape, color, line, and placement is intentional and supports the argument. Thus, creating infographics benefits writers as well, presenting an opportunity to learn a new "grammar" for argumentation.
4. Your Visual "Rhetoric"
When you make a visual argument, it's not unlike a written argument, and just as you have rhetorical goals and use rhetorical moves to achieve them in an essay, so too will you have goals you hope to achieve in your infographic, along with some visual elements and moves you might want to deploy to achieve those goals.
Goals
So, what is your goal when designing a piece of visual communication? Well, just like in an academic essay, you are trying to lead your audience through an argument or message. When the information is presented in an intentional way, your message gets through more effectively. You don’t let words fall accidentally onto the page, and it would disorient your reader if sentences were placed in a random order, or if you included irrelevant evidence. Similarly, when you design your infographic, your goal is to orient your audience and lead their eyes through the information presented in an engaging and effective manner that clearly supports your argument. Your graphic design choices must not be merely aesthetic, but must play a functional role as well.
One last point before getting into the technical stuff: An infographic requires that you synthesize all of the complex information and data you have gathered into one single, digestible page. This actually requires a much deeper understanding of the material than if you were given 10 pages of text to communicate your argument. You have to choose wisely, and communicate effectively using the tools and moves listed below. You must strike a balance between presenting too much information that fails to ignite further curiosity, and too little information that leaves the audience questioning what the information is communicating.
Elements and moves
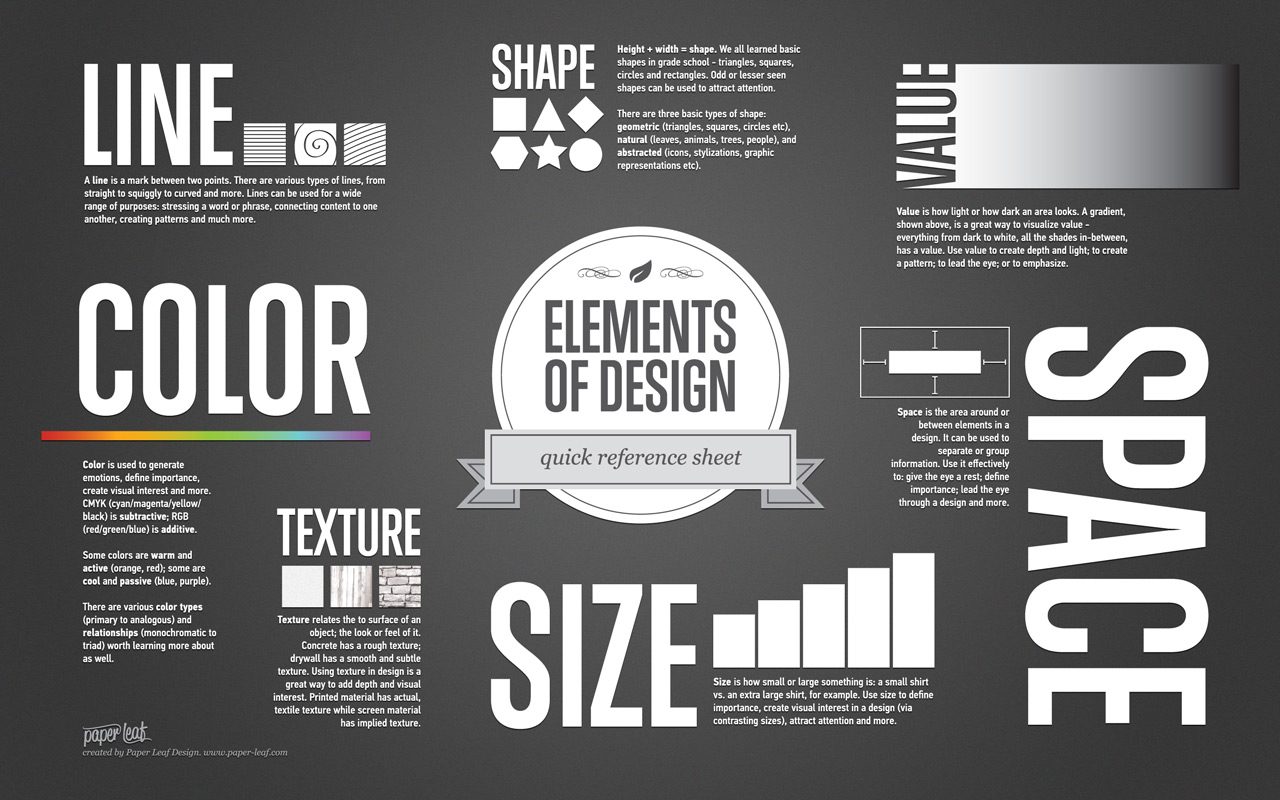
Sometimes called the visual elements and principles of design, these moves are at your fingertips when creating a piece of visual communication. Used skillfully, they support your argument. But if used without careful thought, they could sabotage your intended message.
line, whether straight, curved, thick, thin, solid, dotted, dashed, or intersecting, helps direct the eye, create emphasis, and gives a sense of movement to your infographic.
scale can be used to draw attention to and from certain elements of your infographic, and can create emphasis and drama.
color in infographics can make your message more effective, memorable, and interesting. Color can set the mood and tone of an infographic, and it can guide viewers in how to interpret the information presented.
typography is all about the text in your infographic, from the title to the text blocks that convey the details of your argument. The typography you choose establishes tone, it supports hierarchy, and draws your audience into your argument. Choosing a typography that grabs attention but doesn't distract from your message is crucial. Here are some links to help you decide how to leverage typography in your infographic.
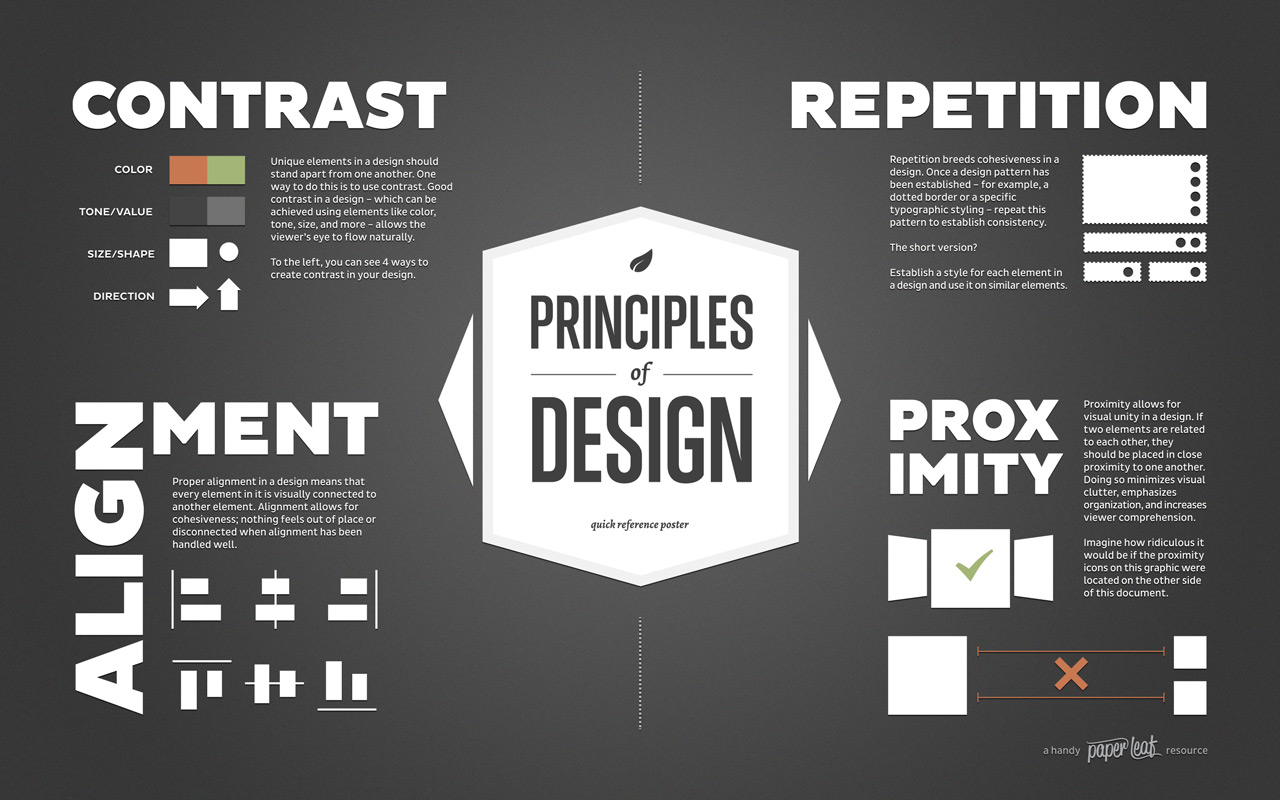
contrast sets pieces of information apart, or draws attention through difference in shape, color, scale, layout, type, etc.
alignment creates order and visually connects parts of your infographic.overall, alignment leads to cleaner, more organized visual communication than if parts of your infographic were placed randomly on the page. use a grid and its gutters to align relevant pieces of visual info.
proximity creates associations between parts of your composition. putting information/graphics in closer proximity suggests a stronger relationship than ones farther apart.
repetition provides emphasis and an implicit rhythm to the visual elements presented.
hierarchy provides structure and guides your audience through the information presented in order of importance. When looking at an infographic, you want the big message to be perceived within mere seconds, and you want the audience to be “hooked” into taking the time to read more detailed information. Hierarchy gives the eye the direction it needs to process complex visual information effectively.
associations provide overall tone and implicit emphasis to argument through color, typography, shape, texture.
balance should be pursued in the entirety of your composition and in its parts.
The anatomy of an infographic:
My infographic checklist:
Thesis: The thesis or main communicative goal of the infographic is clear, defensible, non-obvious, and important.
Clarity: